
All physical goods companies have the same operating model: they procure goods, find customers, and sell finished goods to those customers. True, no company is the same. There are so many differences - in product, distribution, geography, and customer type. But at the very core, they all are in the business of selling stuff.
Inventory Turns is THE core operations and finance metric that measures how efficiently your company turns inventory into revenue.
Inventory Turns is easily calculated using standard financial statements. It's calculated by dividing Cost of Goods Sold (COGS) by the value of Inventory:
Inventory Turns = COGS / Inventory value
Higher turns, the faster your company is at turning inventory into sales. A value of 1 means it takes a year to sell what you have on hand. A value of 12 means you are selling through your inventory every month. For example, here are the inventory turns for three well known DTC brands for last year:
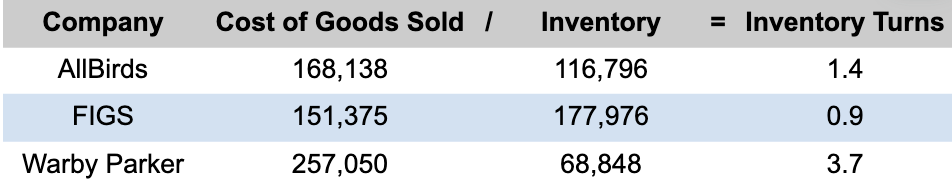
In this group, Warby Parker is by far the most efficient at turning inventory into sales, with 3.7 inventory turns per year, meaning it turns over its inventory about every 3 months. By comparison, FIGS is the least efficient, turning inventory 0.9 times per year, or every 13 months.
Inventory Turns are Down Across the Board
The disruptive influence of the Covid pandemic and its aftermath on supply chains and demand volatility is widely recognized. One way to directly observe this effect is by examining the inventory turnover performance of companies engaged in the sale of physical goods.
To illustrate the variation in turns and impact of Covid in the 2019-2022 period, we conducted an analysis on the inventory turnover performance of a sample of 27 companies during this period (dataset here). The companies come from diverse categories such as Cookware, Home Goods, Footwear, and Apparel.

The impact of Covid was evident, as inventory turnover rates declined across the board during this period. On average, inventory turns fell ~18% from 2019 to 2022. That might not seem like a lot, but that equates to an extra $6.9B in inventory on the books for these 27 companies at the end of 2022.
Performance was not uniform - with some categories and companies maintaining relatively strong turns. It’s not possible to draw causal conclusions from this quick analysis, but it’s tempting to speculate that Cookware and Home Goods held up best due to positive Covid demand shocks.

Within each category, there is significant diversity. For example, amongst the six Footwear companies in our sample, three saw stable Inventory Turns performance and three saw serious degradation - including AllBirds at 1.44 turns, down 32% from 2019.

Notably, the Inventory Turns performance of the Direct-to-Consumer (DTC) companies in our dataset trailed companies with traditional distribution models. DTC companies saw turns fall 33% compared to 13% down for the other companies in the dataset.

Without wholesale and retail partners to ‘absorb’ shocks to supply and demand, DTC and digitally native brands need to be extra focused on managing inventory turns.
The clear message is the essential need to comprehend and effectively manage inventory turnover.
Benchmarking & Improving Inventory Turns
Inventory Turns is not magic - it's math.
From first principles Inventory Turns describes how fast inventory flows through a company. This can be physically described in terms of lead times, demand variability, safety stock, and payment terms. This systems can be measured, managed, and optimized.
At Atomic, our mission is to help brands take control of their inventory to hit revenue goals and smash waste. Our clients are seeing a 50% improvement in Inventory Turns, freeing up millions of dollars of cash from inventory to reinvest in other parts of the business.
One of the first things we do with clients is an Inventory Turns benchmarking, incorporating historical performance and the first principles-based approach to potential performance. This contextualizes performance against peers and makes the business case for investing to improve turns.
Interested in learning more? Set up a 15 min call here.